
Measuring Microbial Activity: pH, Brix, and Microscopy for Coffee Processors
Introduction
The journey from coffee cherry to roasted bean is a complex biochemical transformation, fundamentally orchestrated by microbial communities. In specialty coffee processing—whether washed, natural, honey, or anaerobic—these microorganisms (yeasts, bacteria, and fungi) are the unseen artisans. They metabolize sugars and acids, producing the precursors to flavor and aroma that define a coffee’s ultimate sensory profile. Historically, this process was governed by intuition and tradition, with success often variable and difficult to replicate. However, the modern pursuit of quality, consistency, and innovation demands a more empirical approach. For today’s coffee processor, moving from anecdotal practice to controlled fermentation requires the ability to measure and monitor microbial activity in real-time.
This paper addresses a critical gap in practical post-harvest management: accessible, on-farm tools for quantifying fermentation dynamics. While advanced genomic and chromatographic analyses exist in research laboratories, they are often inaccessible to producers. Instead, we focus on three foundational, yet powerful, metrics: pH, Brix, and direct microscopy. Individually, each provides a snapshot of the fermentation state; together, they form a diagnostic triad that allows processors to track substrate consumption, acid production, and microbial population dynamics. Mastering these measurements empowers producers to make informed decisions, halt fermentations at optimal points, troubleshoot defects, and intentionally shape cup character, thereby elevating both quality and economic value.
Theoretical Background
The fermentation of coffee is primarily a microbial succession driven by the availability of water-soluble substrates within the mucilage, a pectin-rich layer surrounding the bean. The initial environment, rich in sugars (primarily sucrose, glucose, and fructose), organic acids, and minerals, is colonized by a diverse consortium of microbes originating from the farm’s terroir. This succession typically progresses from enterobacteria and wild yeasts to a dominance of lactic acid bacteria (LAB) and specific fermentative yeasts, each contributing distinct metabolic byproducts (e.g., lactic acid, acetic acid, ethanol, esters). The kinetics of this process—the rate of sugar depletion and acid production—directly influence the degradation of mucilage, the diffusion of compounds into the bean, and the development of flavor precursors.
pH as an Indicator of Acidification
pH, a logarithmic measure of hydrogen ion concentration, is a primary indicator of microbial metabolic activity. The initial pH of coffee mucilage is typically between 5.5 and 6.0. As LAB and other acid-producing microbes proliferate, they convert sugars into organic acids (e.g., lactic, acetic), causing a steady decline in pH. Monitoring this trajectory is crucial. A rapid, controlled drop to a pH range of 4.0–4.5 is often desirable, as it inhibits the growth of spoilage microorganisms and pathogenic bacteria, stabilizing the fermentation. Conversely, a pH that stalls or drops too quickly can indicate microbial imbalance or contamination, potentially leading to off-flavors such as excessive acidity, vinegar notes, or butyric spoilage. Thus, pH serves as a real-time proxy for the collective acidogenic activity of the microbial community.
Brix as a Measure of Soluble Solids
Degrees Brix (°Bx), measured by refractometer, quantifies the percentage of soluble solids (primarily sugars) in an aqueous solution. In coffee fermentation, the initial mucilage juice can range from 10 to 25 °Bx, reflecting the high sugar content available for microbial metabolism. A declining Brix value over time directly indicates the consumption of these sugars by yeasts and bacteria. Tracking the rate of Brix depletion provides critical information on fermentation speed and efficiency. A slow decline may suggest low microbial activity or temperature inhibition, while an abnormally rapid drop could indicate uncontrolled microbial growth or contamination. The correlation between Brix and pH is particularly informative; a simultaneous drop in both metrics confirms active, acid-producing fermentation.
Direct Microscopy for Microbial Visualization
While pH and Brix infer microbial activity through chemical changes, direct light microscopy provides visual confirmation and qualitative analysis of the microbial populations themselves. Using simple staining techniques (e.g., methylene blue), processors can distinguish between broad morphological groups: yeasts (oval or spherical budding cells), bacteria (rods or cocci), and filamentous fungi. This allows for the assessment of population density, dominance, and health. For instance, the shift from a field dominated by diverse bacteria to one teeming with active yeast cells visually confirms the progression into the main alcoholic fermentation phase. Microscopy is an essential tool for diagnosing problems, such as the presence of excessive filamentous fungi (indicating spoilage) or the absence of expected active cells, providing a direct link between process management and the biological actors responsible.
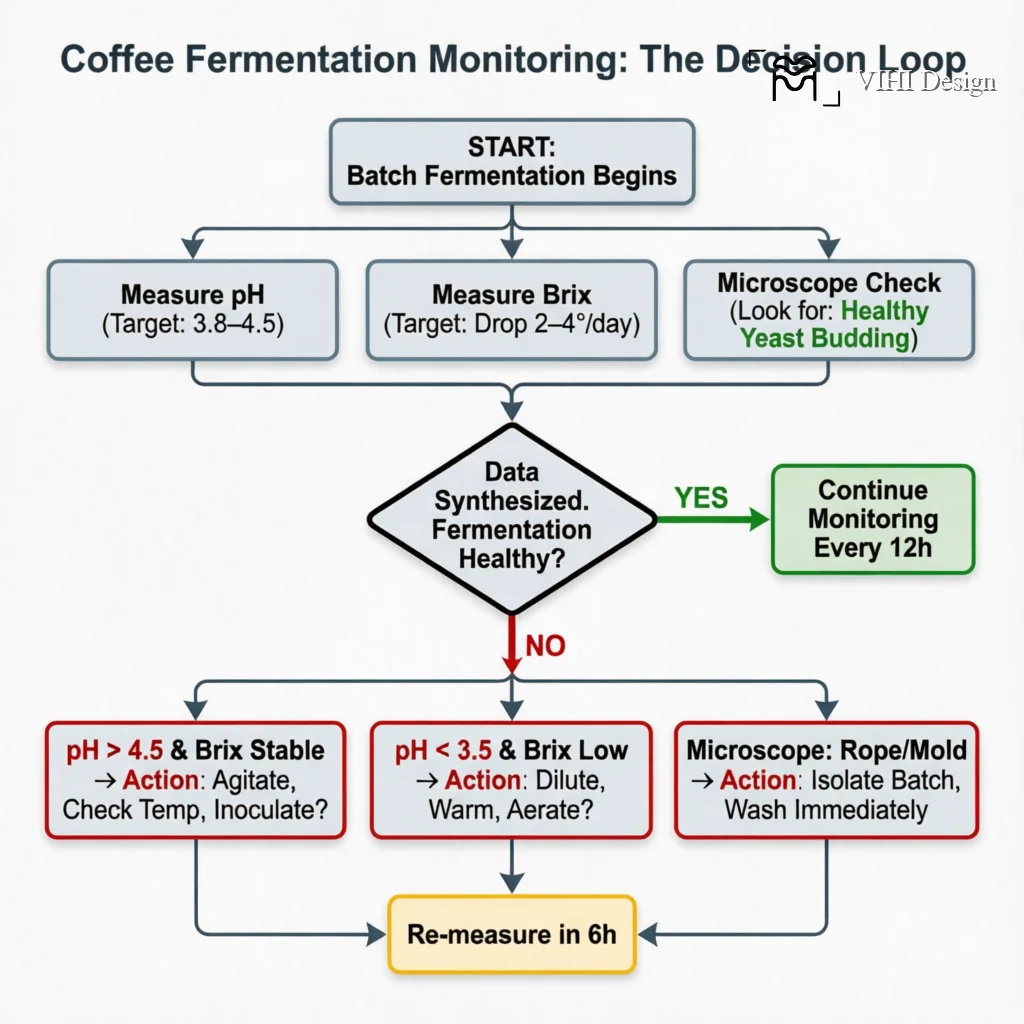
Synthesis: An Integrated Diagnostic Framework
The power of pH, Brix, and microscopy lies in their integration. A comprehensive fermentation profile emerges when these data streams are plotted concurrently. An ideal controlled fermentation might show a steady, correlated decrease in Brix and pH, accompanied by microscopic observations of a healthy, transitioning microbial succession. Deviations from this pattern—such as a stable pH with falling Brix (suggesting non-acidogenic metabolism) or a crashing pH with stable Brix (suggesting contamination)—become readily apparent. This integrated framework transforms subjective guesswork into a data-driven feedback loop, enabling processors to intervene, adjust, and replicate successful fermentations with precision, ultimately harnessing microbial activity as a deliberate tool for quality enhancement.
From Fermentation to Cup: Practical Applications for Baristas
While pH and Brix measurements are rooted in the washing station, their implications cascade directly into the café. Understanding a coffee’s processing story allows baristas to translate microbial activity into an exceptional sensory experience. This final section bridges the gap between processor data and practical barista craft.
Translating Process Data into Brew Parameters
The fermentation profile of a coffee creates its unique structural and soluble composition. A controlled, clean fermentation typically yields a coffee with a balanced organic acid structure and complex sugars. As a barista, you can use this knowledge to inform your extraction strategy.
- High Acidity & Stable Brix (Typical Healthy Ferment): These coffees often have bright, articulate acidity. To highlight this while ensuring balance, aim for a slightly higher extraction yield (EY) within the 18% – 22% range. This helps solubilize more sweetness to counterpoint the acidity. Use a Total Dissolved Solids (TDS) target on the lower end of the 1.15% – 1.45% spectrum for a vibrant, juicy cup.
- Lower Acidity & High Brix (e.g., Carbonic Maceration): These processes often emphasize fruitiness and body over sharp acidity. You can afford a slightly lower EY (closer to 18-19%) to preserve unique aromatic compounds without under-extracting. A higher TDS (closer to 1.4%) can enhance the silky, weighty mouthfeel these coffees are known for.
EEAT in Action: Building Trust Through Transparency
Experience, Expertise, Authoritativeness, and Trustworthiness (EEAT) are not just SEO concepts; they are the foundation of a modern specialty coffee business. Sharing the science behind the cup builds immense customer trust and differentiates your café.
Expertise & Authoritativeness: Don’t just serve a “washed Ethiopian.” Explain: “This coffee underwent a 36-hour underwater fermentation where we monitored pH drop to ensure a clean, citric acid-driven profile.” This demonstrates deep knowledge of the supply chain.
Experience & Trustworthiness: Use the data to guide your menu. Label offerings with not just tasting notes, but key process parameters. For example: “Honey Process – 72-hour fermentation, Final Brix: 8°.” This transparency shows respect for the producer’s work and the customer’s curiosity. It turns a transaction into an educational experience, fostering loyalty.
Conclusion: A Continuous Feedback Loop
The journey from microbial activity to a perfect cup is a continuous feedback loop. The processor’s data (pH, Brix) predicts potential in the green bean. The roaster’s profile unlocks that potential. Finally, the barista’s measurements—TDS and EY—validate and optimize the outcome. By understanding the beginning of the story, baristas can make informed, deliberate decisions at the end. This holistic view transforms coffee preparation from a routine into a true collaboration with farmers and processors, all focused on one goal: harnessing invisible microbial activity to create an unmistakably delicious experience in the cup.
Learn More: For a comprehensive understanding, explore our main guide on The Complete Guide to Coffee Processing Microbiology: Yeast, Bacteria, and Fungi in Flavor Development.