
Introduction to Coffee Roasting Milestones and Their Importance
Coffee roasting is a non-equilibrium thermochemical process that transforms the chemical and physical structure of the green coffee seed (bean) into a consumable product. This transformation is not linear but is demarcated by distinct, audible, and observable events. The two primary acoustic events, known as First Crack and Second Crack, serve as critical empirical milestones for the roaster. They are not merely indicators of roast progression but are the macroscopic manifestations of specific, complex internal bean reactions. Understanding these milestones is fundamental to roast profiling, as they define the boundaries between roast categories (e.g., light, medium, dark) and directly correlate with the development of key sensory attributes. Mastery of these events allows for the precise manipulation of variables such as time, temperature, and energy application to achieve desired flavor outcomes, balancing the development of inherent origin characteristics with the creation of roast-derived compounds.
The Science Behind Coffee Bean Expansion and Moisture Release
The progression through First and Second Crack is governed by the principles of heat transfer, phase changes, and the pyrolysis of organic compounds. The bean’s physical and chemical evolution during roasting can be modeled as a series of endothermic and exothermic reactions driven by the application of thermal energy.
Physical Transformations and First Crack
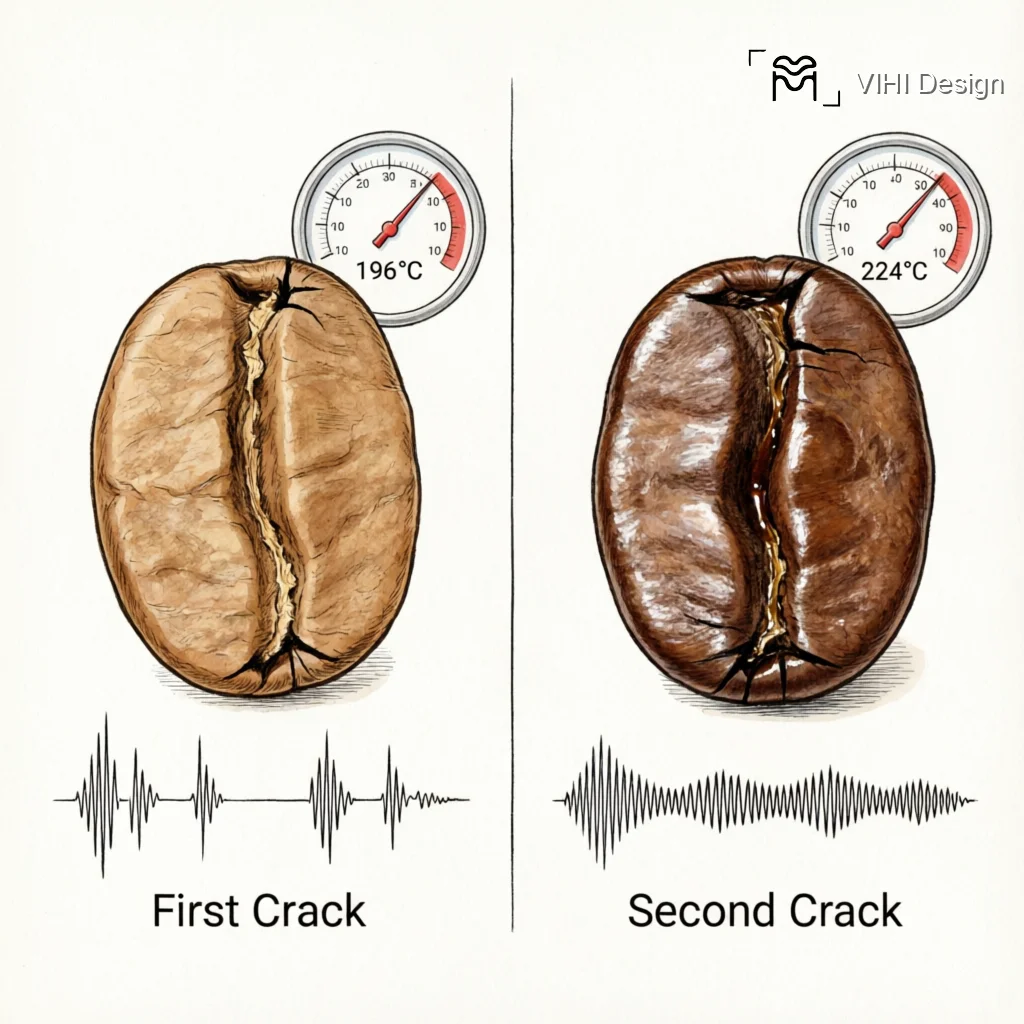
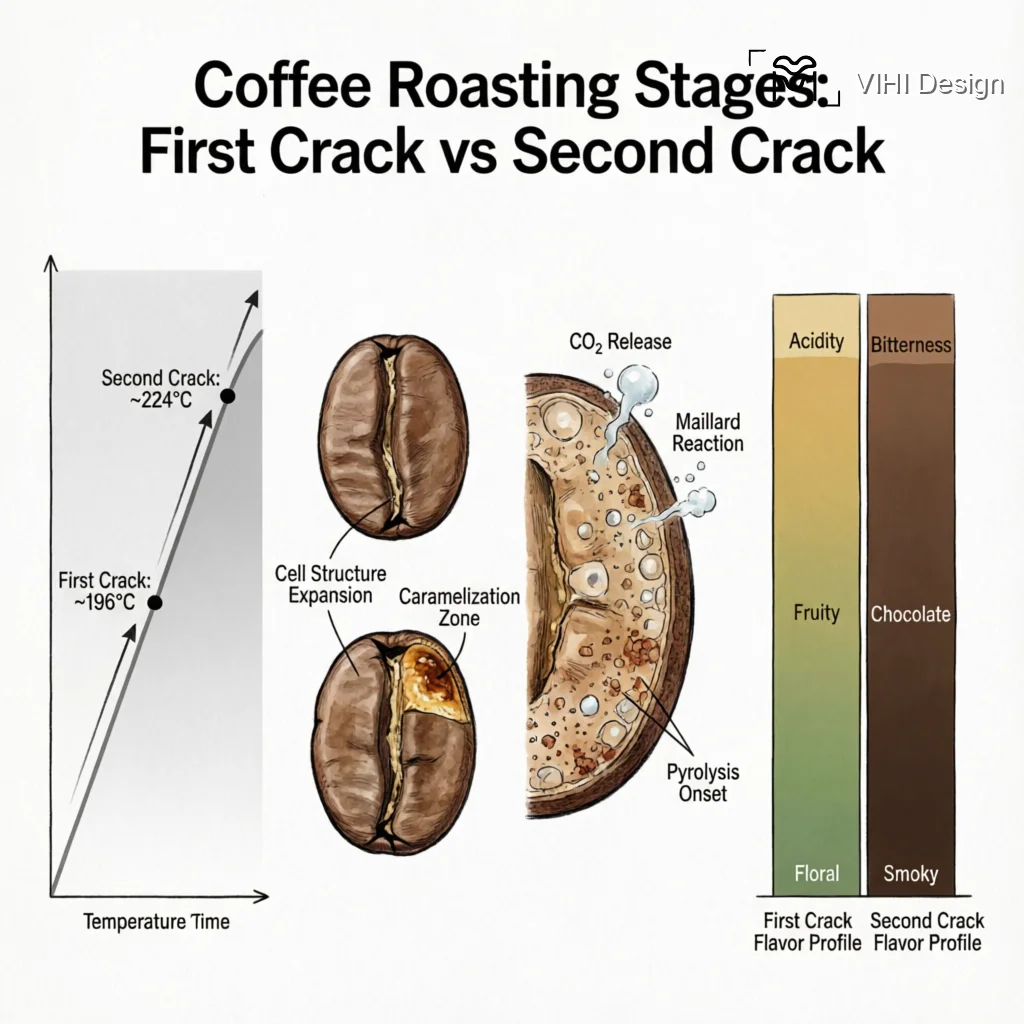
Initially, the bean undergoes an endothermic drying phase where free water is vaporized. As bean temperature rises past approximately 160°C, internal pressure increases due to the vaporization of bound water and the thermal expansion of gases. The bean’s cellulose matrix begins to soften under heat. First Crack, typically occurring between 196°C and 205°C bean temperature, is an audible fracturing event. It is primarily caused by the mechanical failure of the bean’s cellular structure as internal steam pressure exceeds its tensile strength. This event is analogous to the popping of popcorn and marks a significant physical expansion. The bean’s volume can increase by 50-100%, its color changes from yellow/tan to light brown, and its density decreases. This structural failure creates a porous matrix essential for subsequent chemical reactions and for the extraction process during brewing.
Chemical Pyrolysis and Second Crack
Following First Crack, the roast enters an exothermic phase where heat release from the bean can be measured. The bean’s structure, now more porous, allows for increased thermal conductivity and more rapid chemical decomposition. As temperatures approach 224°C to 233°C, a second acoustic event, Second Crack, occurs. This sound is distinct from First Crack—often described as sharper, faster, and more brittle. Second Crack is not caused by steam pressure but by the fracturing of the bean’s brittle cellular walls and the shattering of the internal matrix. This structural failure is a direct result of extensive pyrolysis, the thermal decomposition of organic material in an inert atmosphere. Key processes at this stage include:
- The continued pyrolysis of carbohydrates, including the decomposition of cellulose and hemicellulose.
- The degradation of chlorogenic acids and other phenolic compounds.
- The initiation of more extensive Maillard reaction products and their subsequent breakdown.
- The thermal cracking (breaking of carbon-carbon bonds) of oils migrating from the bean’s interior to its surface.
The release of carbon dioxide (CO2) and other volatile organic compounds (VOCs) during these pyrolytic events contributes to the internal pressure that facilitates the fracturing. Visually, beans enter Second Crack with a darker brown, oily surface, signaling the transition to dark roast development where the original organic compounds of the green bean are largely supplanted by pyrolysis products.
Moisture and Mass Dynamics
Mass loss is a quantifiable metric throughout this process. Green coffee contains 10-12% water by mass. By the conclusion of First Crack, total mass loss typically reaches 11-13%, primarily due to water vaporization. By the onset of Second Crack, mass loss increases to 14-16%, and it can exceed 20% for very dark roasts. This mass loss is attributable to the continued release of water vapor, CO2, and volatile organic compounds from pyrolytic decomposition. The rapid evolution of gases during the cracks contributes measurably to the overall mass loss profile, with the rate of loss accelerating post-First Crack.
Beyond Mass Loss: The Chemical Reconfiguration of the Bean
The documented mass loss of 11-13% through First Crack and 14-20%+ in darker roasts tells only half the story. Concurrently, the bean undergoes a profound chemical metamorphosis. The Maillard reaction and Strecker degradation, dominant in the early stages, give way to more aggressive pyrolysis as roasting progresses. This shift directly impacts the compounds available for extraction. The volatile organic compounds (VOCs) lost include many responsible for grassy, vegetal notes, while creating those associated with caramel, nutty, and eventually carbonized flavors. The bean’s internal structure becomes more brittle and porous, a critical factor for grind uniformity and extraction dynamics.
Quantifying the Outcome: From Roast Loss to Brew Metrics
Roast degree, dictated by the progression through the cracks, establishes the potential ceiling for beverage quality. Three key metrics define the brewing window:
- Total Dissolved Solids (TDS): Measures beverage strength. Target ranges are typically 1.15% – 1.45%. Lighter roasts often extract more efficiently, favoring the higher end, while darker roasts with more soluble ash content can taste harsh at high TDS.
- Extraction Yield (EY): Represents the percentage of coffee mass dissolved into the water. The ideal range is 18% – 22%. Under-extraction (<18%) yields sour, sharp notes; over-extraction (>22%) draws excessive bitter compounds.
- Particle Size: The grind must compensate for bean density and solubility. A denser, lighter roast often requires a finer grind to increase surface area, while a more brittle, dark roast needs a coarser setting to avoid over-extraction of bitter tars.
Ignoring the relationship between roast development (and its associated mass loss) and these brew parameters guarantees suboptimal results in the cup.
Barista’s Field Notes: Addressing Common Struggles
Technical data only becomes valuable when applied against real-world friction points. Here are common struggles and their solutions.
- The “False Crack” Confusion (Home Roasters): Early in the roast, trapped moisture escapes as steam, causing audible pops. These lack the distinct, crisp sound of First Crack. Pro-Tip: Use a combination of sound, smell, AND sight. True First Crack has a sharper, more frequent snap, smells distinctly of baking bread or toasted grain, and the beans will visibly ‘jump’ slightly as moisture escapes violently. Second crack is a finer, faster sputtering sound accompanied by a sharper, almost smoky aroma.
- Batch Inconsistency (Commercial Roasters): Environmental humidity and ambient temperature drastically alter the energy required to reach the cracks, shifting roast timelines. A roast profile that works on a dry, cool morning may rush on a humid afternoon. Implement strict environmental monitoring and adjust charge temperature and gas settings accordingly to hit the same crack milestones at your target times.
- Uneven Roast Development (All Roasters): Receiving or producing a batch where beans range from just past First Crack to well into Second Crack indicates severe uneven roasting. This often stems from inadequate drum speed, poor airflow, or an overloaded batch size. The result is a cup that is simultaneously sour, vegetal, ashy, and bitter. Address this at the roaster by ensuring proper bean movement and thermal application.
Instrumentation vs. Sensory: The Professional’s Validation Loop
While probe data (Bean Temperature, Rate of Rise) provides the map, sensory cues are the ground truth. The mass loss percentage correlates directly with these cues. A 12% mass loss typically aligns with the end of First Crack’s audible activity. A 16% loss often places the batch at the onset of Second Crack. Use a dedicated roast tracking software to log mass loss alongside your temperature curves. Then, validate by cupping. This creates a feedback loop where quantitative data explains qualitative results, enabling precise replication or intentional deviation.
Technical Summary
- Mass loss during roasting, primarily from water vapor, CO2, and VOC release, provides a quantitative measure of roast development, ranging from 11-13% at First Crack to over 20% for very dark roasts.
- The chemical progression from Maillard reactions to pyrolysis, concurrent with mass loss, determines the solubility and flavor compound profile of the final bean.
- Optimal brew parameters (TDS: 1.15-1.45%, EY: 18-22%) are directly constrained by roast degree; grind particle size must be adjusted to match the bean’s developed density and solubility.
- Sensory markers (sound, smell, sight) are non-negotiable diagnostic tools that must correlate with instrument data to ensure roast accuracy and batch consistency.
- Common roasting defects—false cracks, inconsistency, uneven development—stem from misinterpreting sensory data or ignoring environmental variables, and are correctable through disciplined process control.
“`json
“`
“`json
“`
Leave a Reply